Basic Analysis
The Basic Analysis feature helps players and coaches track performance against benchmarks, review key metrics, and identify areas of improvement without overwhelming detail. Here’s a full guide to navigating it.
STEP 1
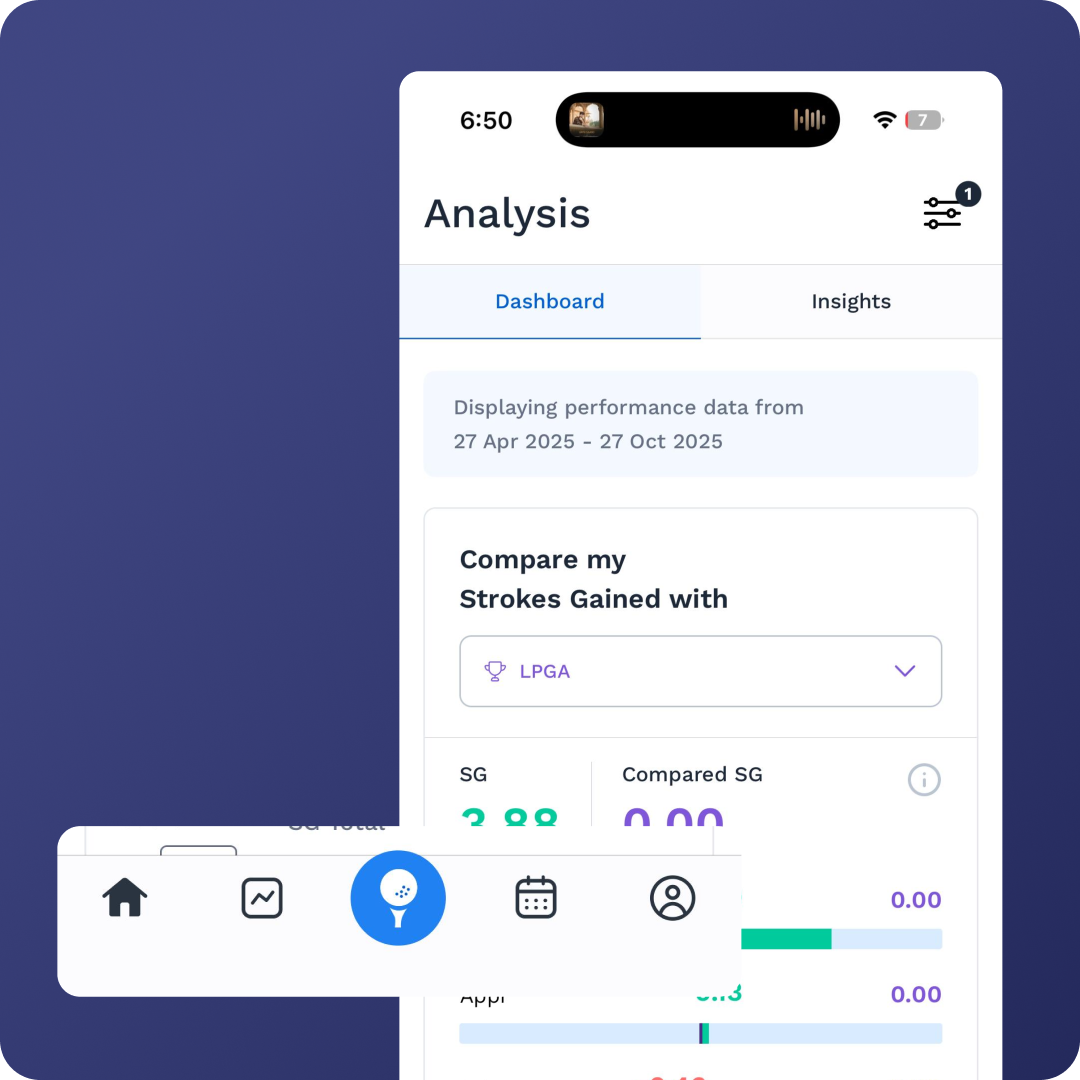
Accessing Analysis
On the home screen, tap the graph icon in the bottom left.
This takes you to the Analysis page.

STEP 2
Global Filters
At the top right, use the Global Filters bar to refine the data you’re viewing:
Benchmarks: Compare against PGA or LPGA standards.
Round Types: Practice sessions vs. tournaments.
Time Windows: Choose presets or create a custom date range.
Round Criteria: View by best, worst, first, or last rounds.
This ensures you can analyze performance in the right context.

STEP 3
Strokes Gained Overview
A graph displays your strokes gained, benchmarked against your selected tour.
You can compare:
By player profile (e.g., Tour Pro, Elite Amateur, Club Golfer).
Against your own past performances.
STEP 4
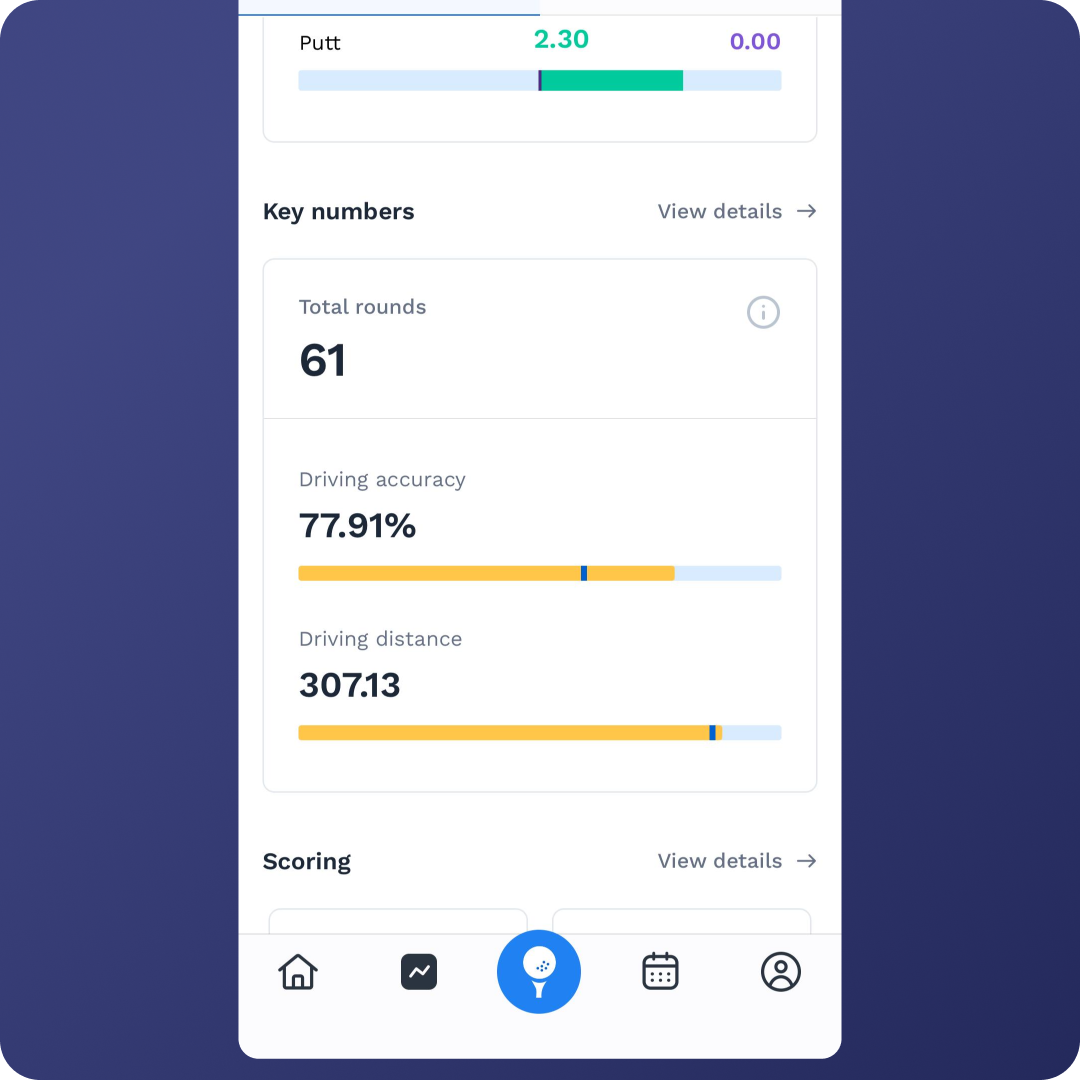
Key Numbers
This section highlights the most important performance stats:
Driving
Driving Accuracy & Distance
Blue lines = Tour Standards for easy comparison.
Tap View Details to access a four-page summary:
Scoring
Accuracy (tee → green)
Accuracy (around the green, 50 yards & in)
Putting conversion rates (by distance)
Scoring Summary
Breakdown by Par 3s, Par 4s, and Par 5s.
Quick view of traditional stats:
Greens in Regulation (GIR)
Up-and-Down %
Average Putts per GIR

STEP 5
Trend Graphs (Tee to Green)
Each bar = one round.
Coaches can monitor season-long trends for players.
STEP 6
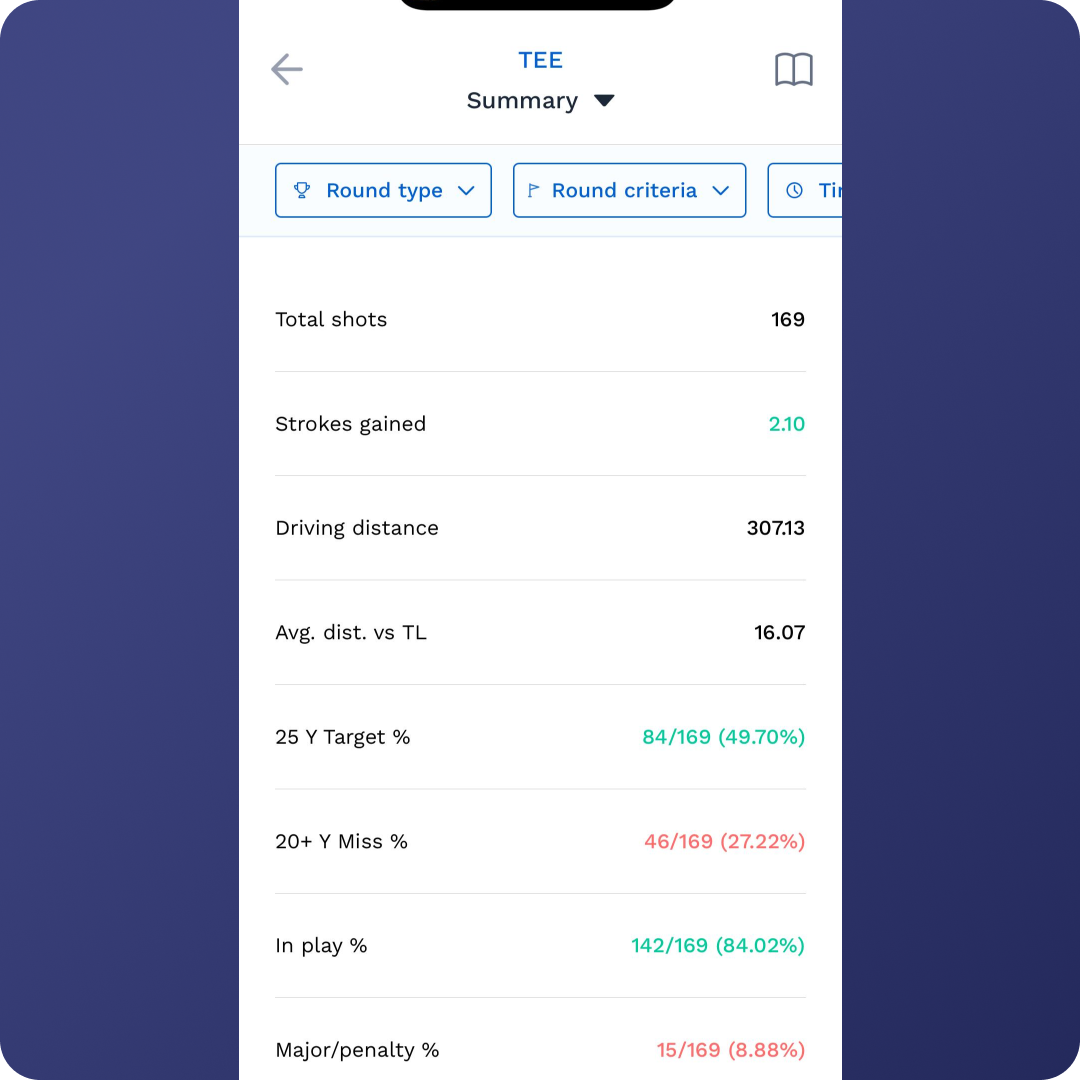
Detailed Area Analyses
Tee Analysis
Strokes gained graphs.
Dispersion chart shows % of shots hit:
Left
Right
Fairway
Approach Analysis
Key metrics: Proximity, Greens Hit %
Strokes Gained vs. Distance → performance by yardage range.
Dispersion Trends for approach shots.
Short Game Analysis
Proximities to the hole from various distances.
Dispersion chart for wedge/short game plays.
Putting Analysis
Conversion rates by distance.
Strokes gained putting.
Direction Page:
Shows performance by break type (recommended to log breaks during entry).
Helps identify strengths and weaknesses on left-to-right, right-to-left, uphill, and downhill putts.
✅ Tip: Start with Key Numbers for a quick snapshot, then dive into trend graphs and dispersion charts for deeper insights. Coaches will find the mental process data especially useful for guiding training and strategy. (Watch Full Tutorial)