Pro Analysis
The Pro Analysis feature provides the most advanced and detailed performance insights in Upgame. It goes far deeper than Basic, offering strokes gained trends, dispersions, Diamonds, and multi-page reports across every part of the game.

STEP 1
Accessing Pro Analysis
Log in and tap the graph icon at the bottom left of the home screen.
This opens the Analysis Page.
STEP 2
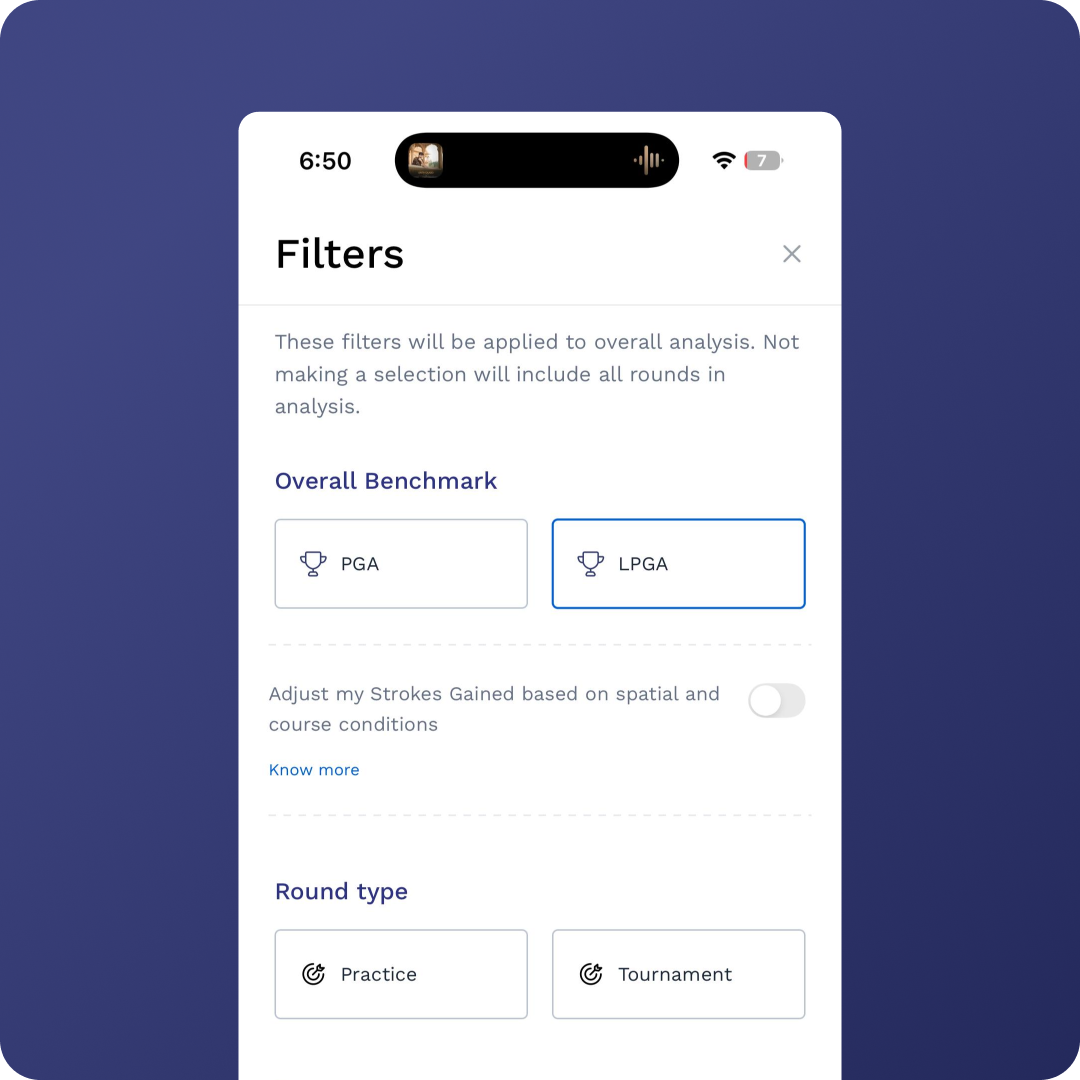
Global Filters
At the top right, use the Global Filters bar to customize your analysis view:
Benchmarks: Compare against PGA or LPGA.
Round Types: Choose between practice sessions or tournaments.
Time Windows: Select preset ranges or create a custom date range.
Round Criteria: Analyze rounds by best, worst, first, or last.
STEP 3
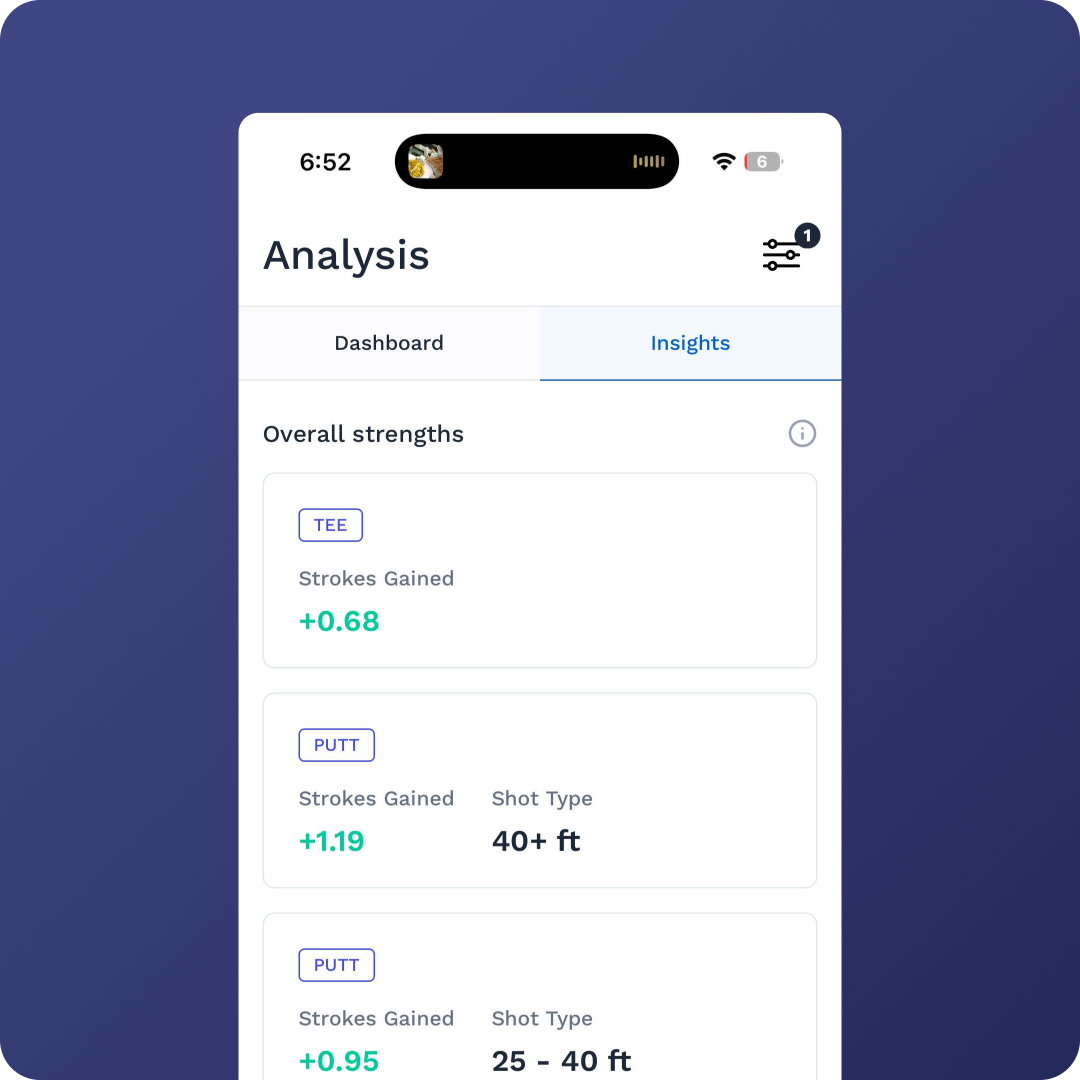
Dashboard & Insights Tabs
At the top of the Analysis page you’ll see two tabs:
Dashboard → Full statistical breakdown with strokes gained, key numbers, trend graphs, and analysis sections.
Insights → Highlights your top 3 performance areas and 3 areas that need improvement for fast takeaways.

STEP 4
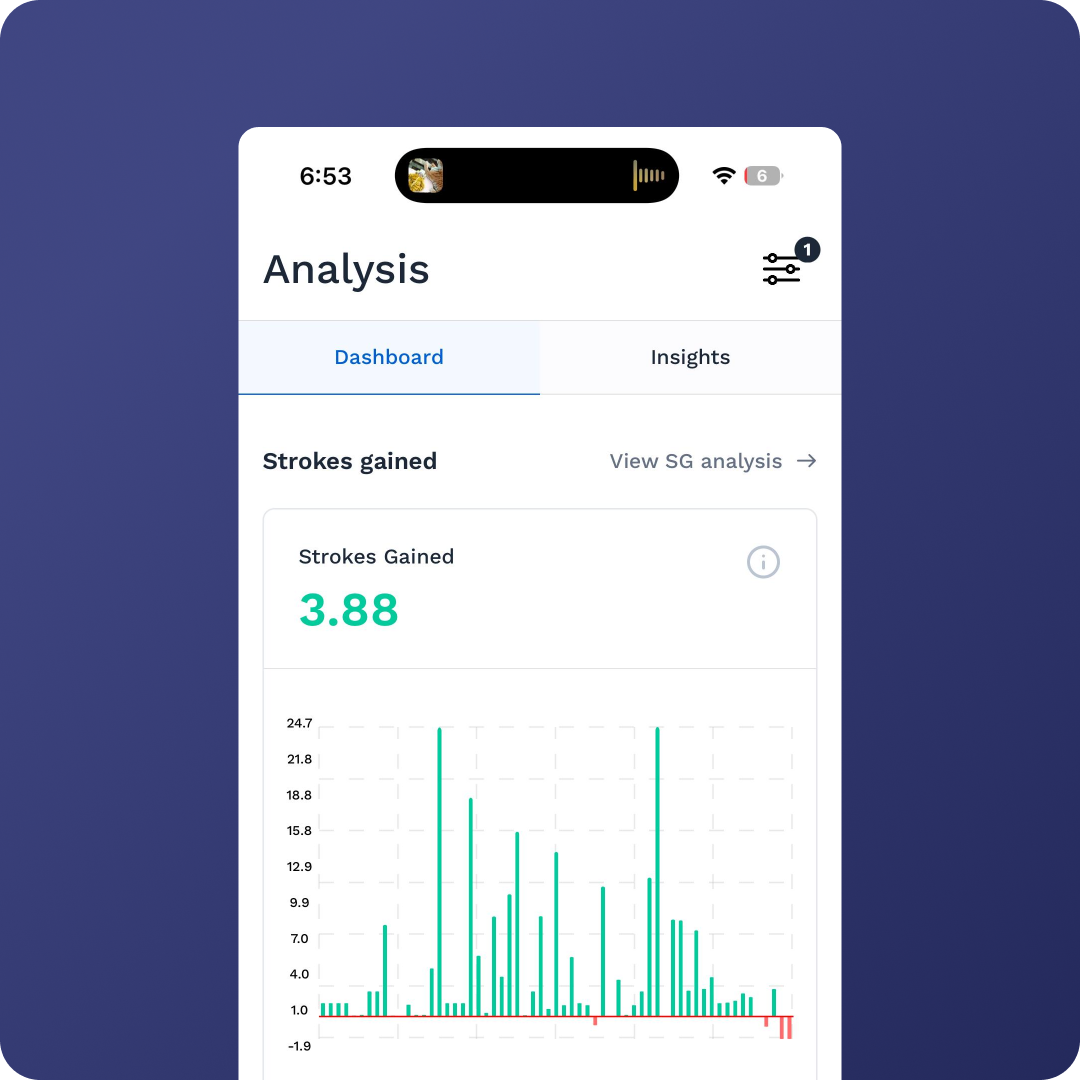
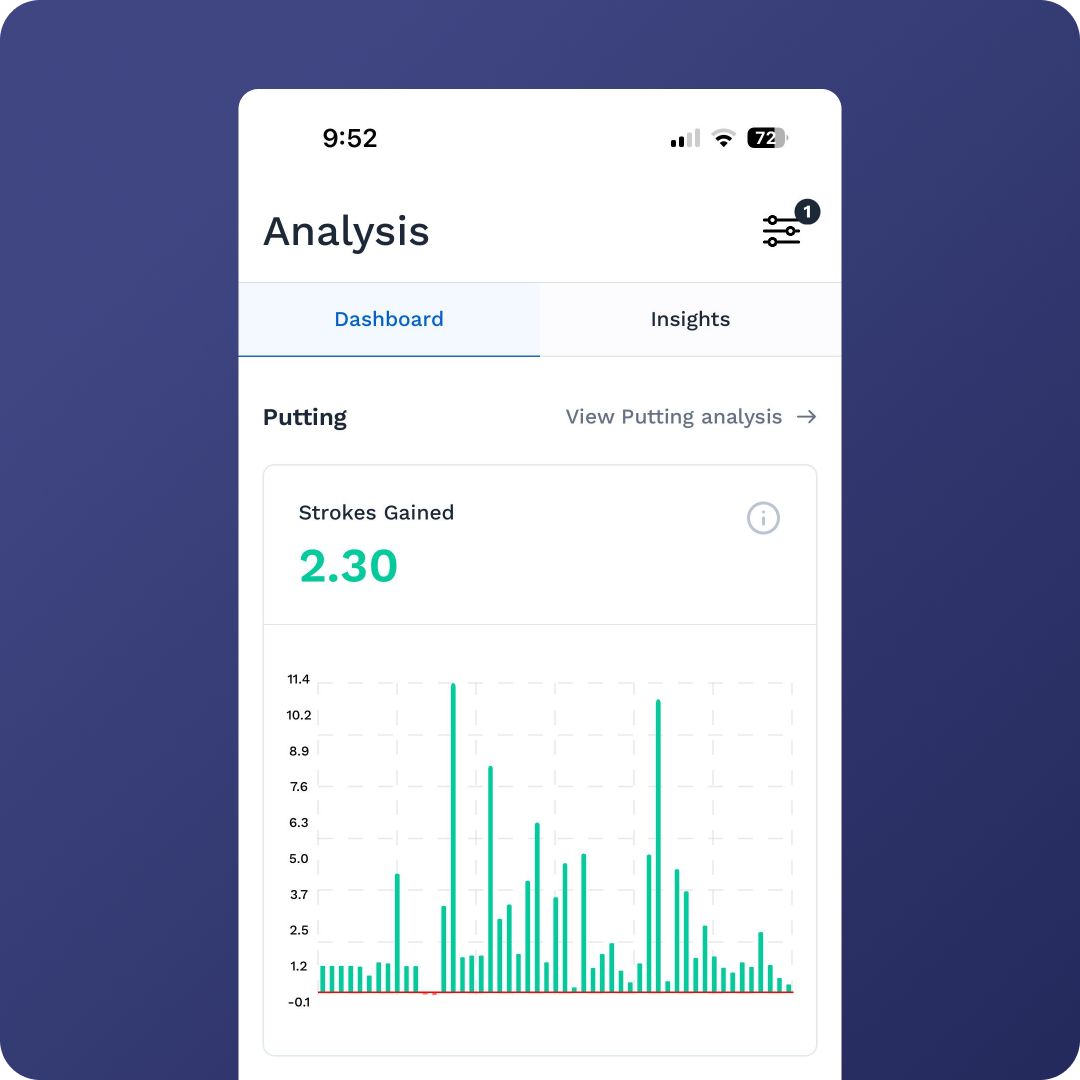
Strokes Gained Overview
Dashboard shows a graph of your strokes gained benchmarked against your selected tour (PGA or LPGA).
You can compare against:
Player profiles (Tour Pro, Elite Amateur, Club Golfer).
Your own previous performances by creating benchmarks from past rounds.

STEP 5
Key Numbers Section
Displays Driving Accuracy & Distance, with blue lines representing tour standards.
Tap View Details → access a 4-page summary:
Scoring
Accuracy tee → green, including end shot result metrics
Accuracy around the green (50 yards & in)
Putting conversion rates from different distances
On the main page you’ll also see:
Scoring summary by hole type → Par 3s, Par 4s, Par 5s.
Traditional stats:
Greens in Regulation (GIR)
Up & Down %
Average putts per GIR
STEP 6
Trend Graphs
Coaches and players can track improvement over time with round-by-round graphs. Each bar represents a single round.
Tee-to-Green Trend Graph → Overall strokes gained breakdown.
Tee Performance Trend Graph → Shows tee shots across rounds.
Approach Trend Graph → Strokes gained on approach play.
Short Game Trend Graph → Strokes gained in wedges and chips.
Putting Trend Graph → Strokes gained putting each round.

STEP 7
Tee Analysis
Tap View Tee Analysis to dive deeper:
Dispersion Percentages within distance windows.
Dispersion Graphs showing end shot results relative to the target line.
End Shot Results separated into 5 categories:
In Play
Minor Miss
Major Miss
Penalty 1 (hazard)
Penalty 2 (lost ball/re-tee)
STEP 8
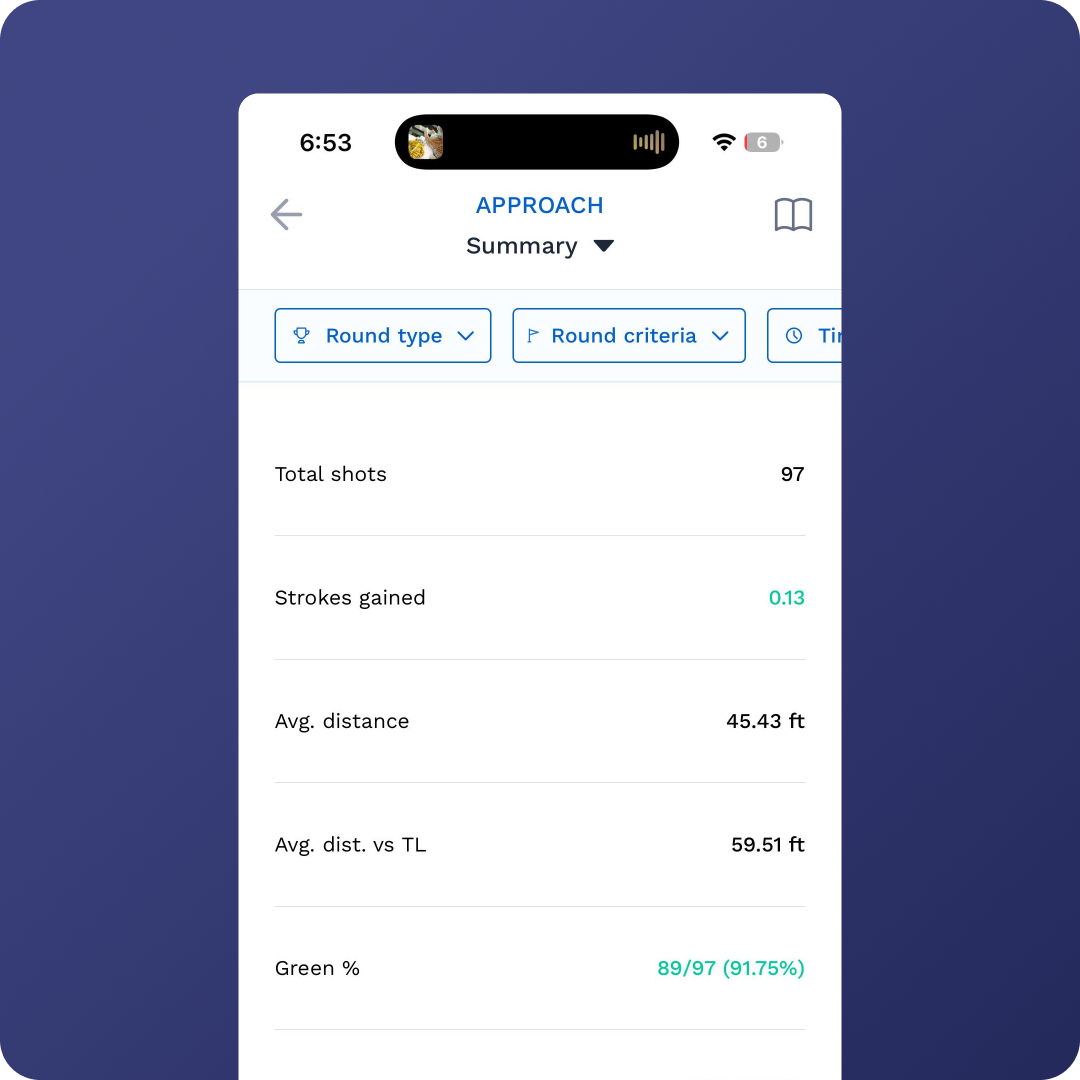
Approach Analysis (7 Pages)
A complete breakdown of approach performance:
Strokes Gained vs Distance → Highlights weak distance windows.
Feet vs Distance → Average proximity to the pin by yardage.
Target Feet vs Distance → Proximity to intended target instead of flag.
End Result vs Distance → Color-coded by end shot outcome.
Dispersion Page → Charts showing shot dispersions relative to the target or flag; compare target vs. flag dispersion.
End Shot Results (6 categories):
Green Hit
Easy
Medium
Hard
Penalty 1
Penalty 2
Comparison Pages → Analyze dispersions and results across multiple windows.

STEP 9
Upgame Diamonds
Exclusive tool in Pro Analysis to refine approach targeting:
Each diamond suggests the safest aim point based on your dispersions.
Example: If the right corner shows “7y,” it means aim 7 yards from the right edge if the pin is tucked closer than 7 yards from that side.
Diamonds are generated using your best shot percentages from rounds logged.
Can be filtered by clubs instead of distances.
Helps build smarter aim strategies on approach shots.

STEP 10
Short Game Analysis (3 Pages)
Tap View S.Game Analysis to see:
Proximities by difficulty → Easy, Medium, Hard short game shots.
Dispersion Charts → Shot spread patterns for wedges and chips.
Distance Breakdown → Average proximities to the pin across distances.
STEP 11
Putting Analysis (6 Pages)
Tap View Putting Analysis to access:
Strokes Gained vs Distance → Quick view of strongest and weakest putting ranges.
Speed vs Distance → Color-coded bars showing speed control outcomes by distance (e.g., Holed, Past, Short, SZ Past, SZ Short).
Conversion Rates → Make rates by distance windows, including 3-putt percentages.
Break Analysis → Track performance on left-to-right, right-to-left, uphill, and downhill putts.
Line Analysis → Percentage of misses Left, Right, or On Line.
Slope Analysis → Categorize performance by break severity (gentle, moderate, severe).
✅ Summary of Pro Analysis Benefits:
Two-tab system (Dashboard + Insights) for quick overviews and detailed deep dives.
Multi-page breakdowns across tee, approach, short game, and putting.
Diamonds tool for smarter approach targeting.
Comprehensive dispersion and trend graphs.
Mental, technical, and situational performance data all in one place.