How to use data to get the most out of your driving
Introduction
Driving always seems to be a hot topic in modern golf. The drastic increase in distance off the tee on the PGA tour and its apparent importance to success has led many to conclude that you need to hit big to win big.
Whilst bigger hitters tend to lead the strokes gained off the tee statistics, you can’t assume that distance will automatically equal success. An example of this is Matthew Wolff who despite being ranked 8th in driving distance on the PGA tour in 2021averaging 312.8 yards, is ranked 170th for strokes gained off the tee losing on average 0.274 strokes per round. Compare that to Matt Fitzpatrick, who is ranked 13th for strokes gained off the tee despite only ranking T132 for driving distance averaging 292.2 yards.
These numbers once again highlight that golf is a varied game with more than one way to succeed. Therefore, data must be used to identify how to get the best out of the tools a player has. Let’s dive into how we can use data to truly analyse tee shot quality and identify where players can and should look to improve.
How best to measure success off the tee?
Strokes gained off the tee is probably the most valuable statistic to identify whether you’re driving the ball well. The emergence of strokes gained has allowed us to compare different aspects of players games and identify how thatis contributing to their overall score. When looking at how you are driving this should be the first stat you look atbecause it is the most accurate and reliable statistic for answering the question, ‘how well have I been playing off the tee?’. So far on the PGA tour in 2021, the winners are averaging +0.66 strokes gained off the tee with a top 10 average of +0.48. No surprise that winners are driving the ball better than the rest.
What about driving distance and driving accuracy? Well, if we again look at the average winners in 2021, they are driving it longer and straighter on average than the rest. Again, not exactly surprising or insightful.


Unfortunately, driving distance isn’t something you can improve from one week to the next. Also, despite driving accuracy being slightly higher in winners, the reality is that this only equates to ~2 more fairways over four rounds. Hardly a major difference-maker.
The reality is that there is so much variation in the way players hit the ball off the tee that looking at averages in this instance isn’t going to be useful. Rory McIlroy and Collin Morikawa have both won on the PGA this year with 0.57 strokes gained off the tee, yet McIlroy won with a driving distance of 324.5 yards and an accuracy of 34%. Compare that to Collin, he had an average driving distance of 285.5 yards and an accuracy of 84% when he won. Same result, different methods. We need to know more than distance and accuracy to gain a true insight into how well someone is driving the ball.
Are you getting the most out of your distance?
I again want to repeat that you must use data to help a player identify their strengths and weaknesses. If you hit it 280 yards off the tee, we want to know how to get the most of this. The first thing to understand is that a relationship does exist between distance and strokes gained off the tee (r=0.6), which can be seen in the graph below. This tells me that longer hitters have the ‘potential to gain more strokes off the tee than shorter hitters.

Above is a graph of all the players on the PGA tour between 2015 and 2021 and the relationship between their driving distance and Strokes Gained off the tee. Because a relationship does exist, we can calculate the relationship using the equation of the trend line:
Strokes gained off the tee = (0.024 x driving distance) – 7
This equation can be used to get an estimate of someone’s strokes gained based off how far they hit the ball. What this then allows us to do is get an estimate as to whether a player is getting the most out of their driving distance.
Let’s put this into practice and compare two different players so far in 2021, Matt Fitzpatrick and Will Gordan. So far in 2021, Matt Fitzpatrick has averaged 292.2 yards off the tee. This means ‘par’ strokes gained off the tee for him is:
(0.024 x 292.2) – 7 = +0.013
His actual strokes gained so far is +0.576 and so he is overperforming off the tee for his distance.
Will Gordan has averaged 314.9 yards off the tee in 2021 and ‘par’ strokes gained off the tee is:
0.024 x 314.9 – 7 = +0.558
His actual strokes gained off the tee so far in 2021 is +0.247 and so he could be getting more out of his distance. Essentially this tells us he isn’t getting the most out of his distance compared to Matt Fitzpatrick. Whilst this isn’t a perfect equation it does give us a great estimation of how well you are driving the ball relative to how far you hit it.It also gives us the chance to compare to guys driving quality, irrespective of distance.
So far on the PGA tour in 2021, more than 75% of the winner have overperformed on strokes gained off the tee relative to their driving distance.
The Problem with the driving accuracy statistic
Ever since the strokes gained statistic emerged, the importance of the driving accuracy statistic has reduced, and it is clear to see why. The leaders in strokes gained off the tee aren’t those with the best driving accuracy and if we analyse the graph below, we can see why, with no significant relationship existing between driving accuracy and strokes gained off the tee (r=0.2).
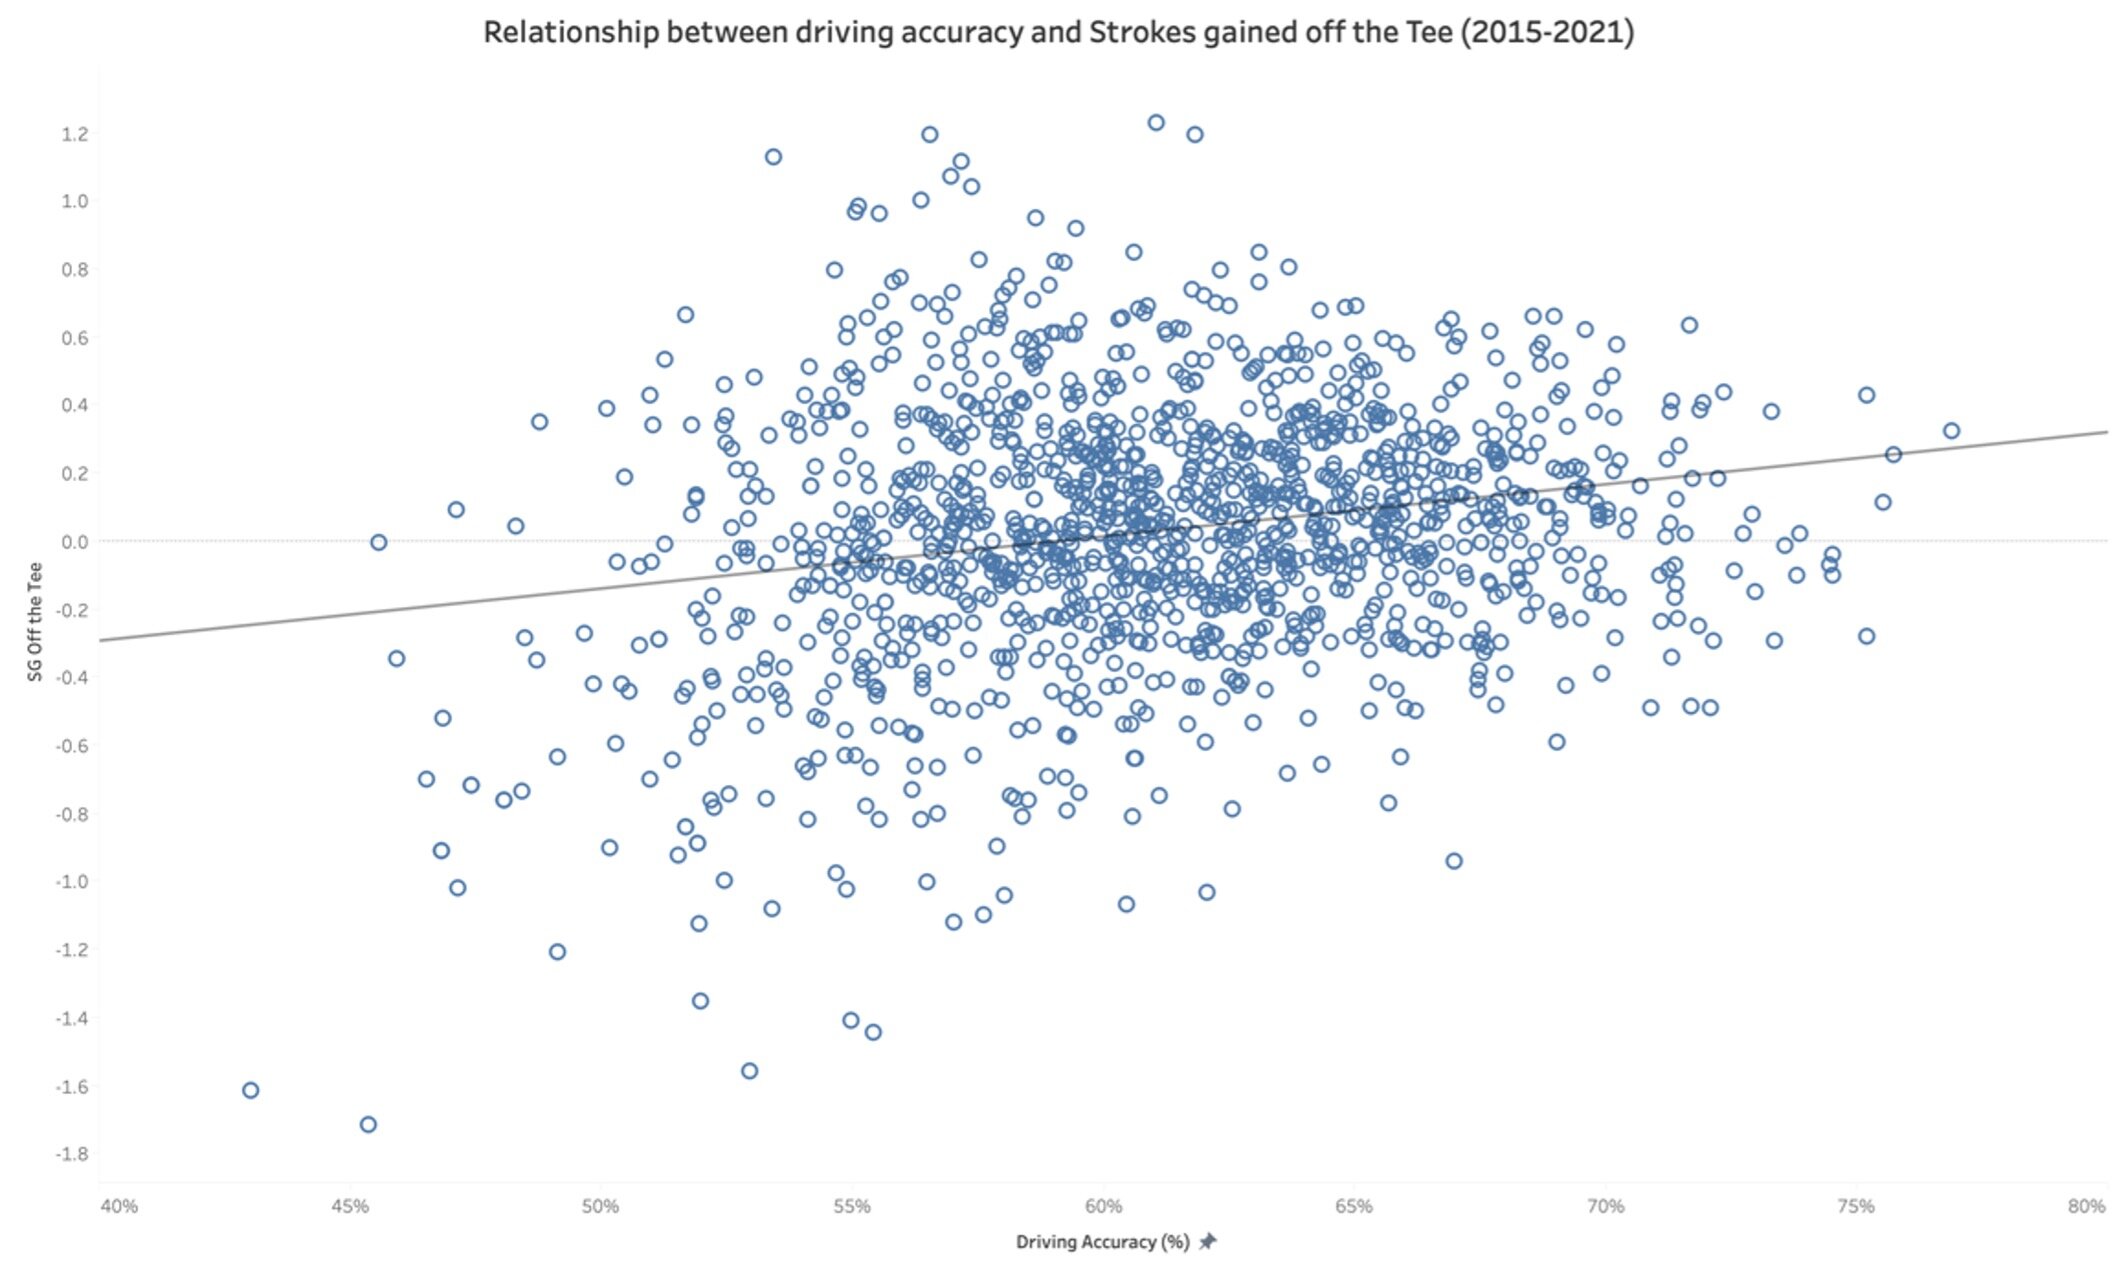
The biggest example of this is when Rory McIlroy won the Wells Fargo Championship this year, he gained +0.572 off the tee, yet only hit 34% of fairways.
The problem with the driving accuracy statistic is that it assumes that all fairways hit are equal and all fairways missed are equal. We all know that this is not the case because no two holes are the same. There is so much variation in fairway width, rough length, trees or no trees and even hole shape. It is possible to hit the fairway and be on the wrong side of a dogleg, meaning you have to manipulate your shot significantly. On the other hand, you can miss the fairway but have a great lie with a clear shot at the green.
However, these numbers again don’t mean you can just smash driver anywhere on the course and be at an advantage. The key to the success of the tee is knowing where you can miss and where you can. A great example of this is when Bryson Dechambeau won the US Open, he only hit 41% of fairways that week. However, he knew that on a lot of the holes he could use his distance to get close enough to the hole where missing the fairway wouldn’t be an issue. He ranked 2nd in strokes gained off the tee that week gaining 1.332 on the field per round.
Compare that to the most recent Major, the open championship, Bryson tried to adopt a similar tactic. He hit 46% of fairways, more than his US Open victory, but with the links-style rough at Royal St Georges, he was having to chip out sideways or ‘hack it’ out back in play. He wasn’t able to manage his misses on this course due to the different conditions and suffered the consequences.
The reality is that hitting the fairway is more important on some holes than others, and it’s about understanding where you can afford to miss and where you can’t.
How to better measure driving accuracy
If we want to access accuracy accurately, then we must measure from a fixed point. Driving accuracy isn’t a consistent measure because fairway size will vary from hole to hole. What we want to know is your distance from a fixed point, ideally your target line.
The PGA does a close equivalent to this with the ‘distance from the centre of the fairway’. Whilst this isn’t perfect as players won’t always be aiming straight down the middle, it does give us a good indication of the true accuracy of players.

Interestingly there is no significant difference in this stat between the winners, top 10 or the rest. This can be partially explained by the fact that longer hitters will tend to have a higher distance away from the fairway because the further you hit the ball, the more offline it can go. We can, however, learn so much about the effectiveness of a player’s strategy from this number if we analyse it alongside strokes gained and driving distance.
Let’s look at two guys with similar driving distances, Dustin Johnson (312.9 yards) and Matt Wolff (312.8 yards). Dustin Johnson has an average distance from the fairway of 31 feet 3 inches which is ranked 206th on the tour. Matt Wolff on the other hand has an average distance from the fairway of 27 feet 1 inch and is ranked T163. However, if we look at their strokes gained off the tee Dustin Johnson is ranked 17th gaining 0.523 per round, whereas Matt Wolff is ranked 170th losing 0.274 per round. So, what can we learn?
Dustin Johnson, despite being less accurate with the same driving distance, has been more effective off the tee. His strategy has been more effective, and he has managed his misses better than Matt Wolff. So, if your Matt Wolff you should focus less on your swing and more on your strategy.
Having the understanding of not only your driving distance but also your dispersion from the target/fairway centre allows you to be able to effectively plan and strategies where you can and can’t afford to miss. The best drivers in the world do this better than anyone.
Using the upgame pro app, we can gather an even more accurate representation of this because we can pinpoint exactly where we were aiming off the tee on every hole. What this allows us to do is have a fixed and consistent measurement of driving accuracy, no matter the hole.
With the upgame app, we can also measure the true end shot result with the ability to apply context to the situationand not just whether you hit the fairway or not. The end shot result is broken down into five different options:
1) In-play: A ‘good drive’. Fairway/semi-rough or greenside if attempting to drive a short Par 4
2) Minor: Still a clean shot at the green but lie means an element of control is lost.
3) Major: Think half a shot penalty. You can hit a normal shot at the green due to thick rough, trees, bunker lip etc
4) Penalty 1: into water and dropping, or chipping out complete sideways
5) Penalty 2: Lost ball or out of bounds
The advantage of having these two stats rather than just fairway hit or missed is we now can access not only shot execution but also shot strategy. If you have a small distance from the target but a high major/penalty % off the tee, then we can see that you are hitting good shots but picking poor targets. Now we have something tangible to move forward with.
Using stats to direct strategy and practice
With the knowledge that we now have of tee shot statistics, we can start to paint of picture of players driving and begin identifying where they can and should improve.
Initial we want to look at strokes gained off the tee to give us an initial idea of how they are driving the ball and whether it has been a strength or weakness. For a player like Bryson Dechambeau, who I currently 6th in the FedEx Cup standings, it has been a strength of his, gaining 1.130 shots per round and ranking 1st in strokes gained off the tee. In contrast, Jordan Spieth despite being 2nd in the FedEx Cup standing is ranked 117th in strokes gained off the tee losing -0.009 per round. This is an area he can look to improve.
Once the initial question is answered, then you want to identify what is causing you to be strong or weak and then build a plan around this to improve. Is it distance, accuracy, strategy or a combination of some/all of these factors?
Using Upgame’s unique metrics we can start to answer these questions more accurately. Also coming soon, you will have the ability to plan strategy in the app using your dispersion patterns. This can become a really powerful tool to start to optimise your own game using your data