How important is making putts when winning tournaments?
Making putts has forever been an essential component of winning tournaments. This was once again brought to light at Torrey Pines where John Rahm holed two crucial birdie putts on the 71st and 72nd hole to win by one shot and become the first Spaniard in history to win the US Open. Almost every week on the PGA tour we can highlight a specific putt that was either made or missed that, in the end, lead to victory or defeat.
It can, however, be forgotten that tournaments aren’t won or lost on one single putt but instead consistent performance with the putter over all four rounds. With this in mind, let's dig a little deeper into where the difference is made with the putter.
How well do you need to putt to win?
We have used the shotlink data available to look at the average make percentage of each winner on the PGA Tour in 2021 and compared it to the top 10 and entire tour average. Because holing a 3-foot putt is significantly easier than holing a 40-foot putt, we have broken down the putts holed numbers into six distance ranges: Inside 3ft, 3-5ft, 5-10ft, 10-15ft, 15-25ft and Outside 25ft. Below we can see the breakdown:

Whilst it isn’t a surprise that winners are making more putts than the tour average (44.2% vs 39.6%) it is necessary to dig a little deeper to gain more useful insights into what is the biggest contributor to success. There’s no use telling a player ‘You need to hole more putts to win’. Not only is this obvious it doesn’t provide them with any information that they can use to improve.
The first point to take from this graph is there is no significant difference in putts holed inside three feet. All players on the PGA Tour are holing virtually 100% of putts and there is no opportunity to make any gain on the field from this range.
Over the other distance ranges, winners are making small gains on the rest, more so inside 10 feet than outside 10 feet with the biggest separation made between 5-10 feet.

If we isolate putts from 5-10 feet, players are averaging around 17 putts over a four-round tournament with winners holing just over 10% more putts, which makes up about 1.8 shots for the week. Whilst this doesn’t seem like a lot, 2 shots in a tournament is a huge amount of money, FedEx cup points, world ranking points and can certainly be the difference between winning or just missing out. Last week at the Rocket Mortgage Classic, Cameron Davis won over $1,000,000 more than Bubba Watson, who finished 2 shots behind him.
Compare that to putts from outside 25 feet, winners are holing only 2.5% more putts than average. Over a four-round tournament, this is only 0.45 shots, less than half a shot difference over an entire tournament.
The graph below highlights this point further by showing the one-putt percentage from 5-10 feet of all the winners in 2021 (only shows tournaments with available data). The green bars indicate a one-putt percentage greater than the tour average.

Whilst there is some variation in the numbers, winners are consistently making more 5-10 footers than average. More than 75% of PGA tour winners in 2021 have a make percentage above 60% from 5-10 feet.
Putts holed from 5-10 feet correlated more strongly than any other range to strokes gained putting
The importance of holing putts from 5-10 feet can be reinforced further by how much it has correlated to strokes gained putting in 2021. The graph below shows the average one-putt percentage from 5-10 against the average strokes gained putting per round of all the players on the PGA Tour in 2021. It has a correlation coefficient of 0.75, indicating a strong positive correlation.

Correlation coefficient of other distances ranges:
• 0-3 ft = 0.42
• 3-5 ft = 0.58
• 10-15 ft = 0.50
• 15-25 ft = 0.45
• >25 ft = 0.36
The specific values and how they are calculated are not important for players and coaches. What this does however highlight is the importance of being able to make putts from 5-10 feet. If you want to be a consistent performer on the PGA tour and give yourself plenty of opportunities to win you have to be able to hole putts regularly from this range.
There’s more than one way to win
Whilst looking at averages gives us a great insight into what it takes to win, it doesn’t account for the variability involved in golf and how there is more than one way to win. To demonstrate this, let’s look into two contrasting performances from two different winners on the PGA tour in 2021, Jordan Spieth and Brooks Koepka.
Jordan Spieth back in April announced his return to the winner’s circle with a win at the Valero Texas Open by 2 strokes with a score of -18 for the 4 rounds and an overall putt make percentage of 61.11% for the week. These putting numbers are remarkable and made him the player with the highest putt make percentage to win during the 2021 season, greater than 20% more putts holed than the tour average.

What is probably the most interesting takeaway from that putting performance is that the only difference between Jordan’s win and other PGA Tour wins is his putting from 5-10 feet where he holed 76.5% of his putts. This was an astonishing 20.5% greater than the tour average and 10% greater than the average winner on tour.

Not only was his make percentage higher, but it is also where he had the most putts from outside of three feet and so over the week, this was an area where he gained significantly on the field.
On the other hand, if we take a look at Brooks Koepka who won The Waste Management Phoenix Open back in February, the putting numbers appear very different. Despite a one-shot victory and a similar winning score to Jordan Spieth of -19, his putt make percentage was only 33% for the week nearly 3% less than the Tour average. These numbers suggest he had a poor putting week, but when we analyse the stats further, this was not the case.
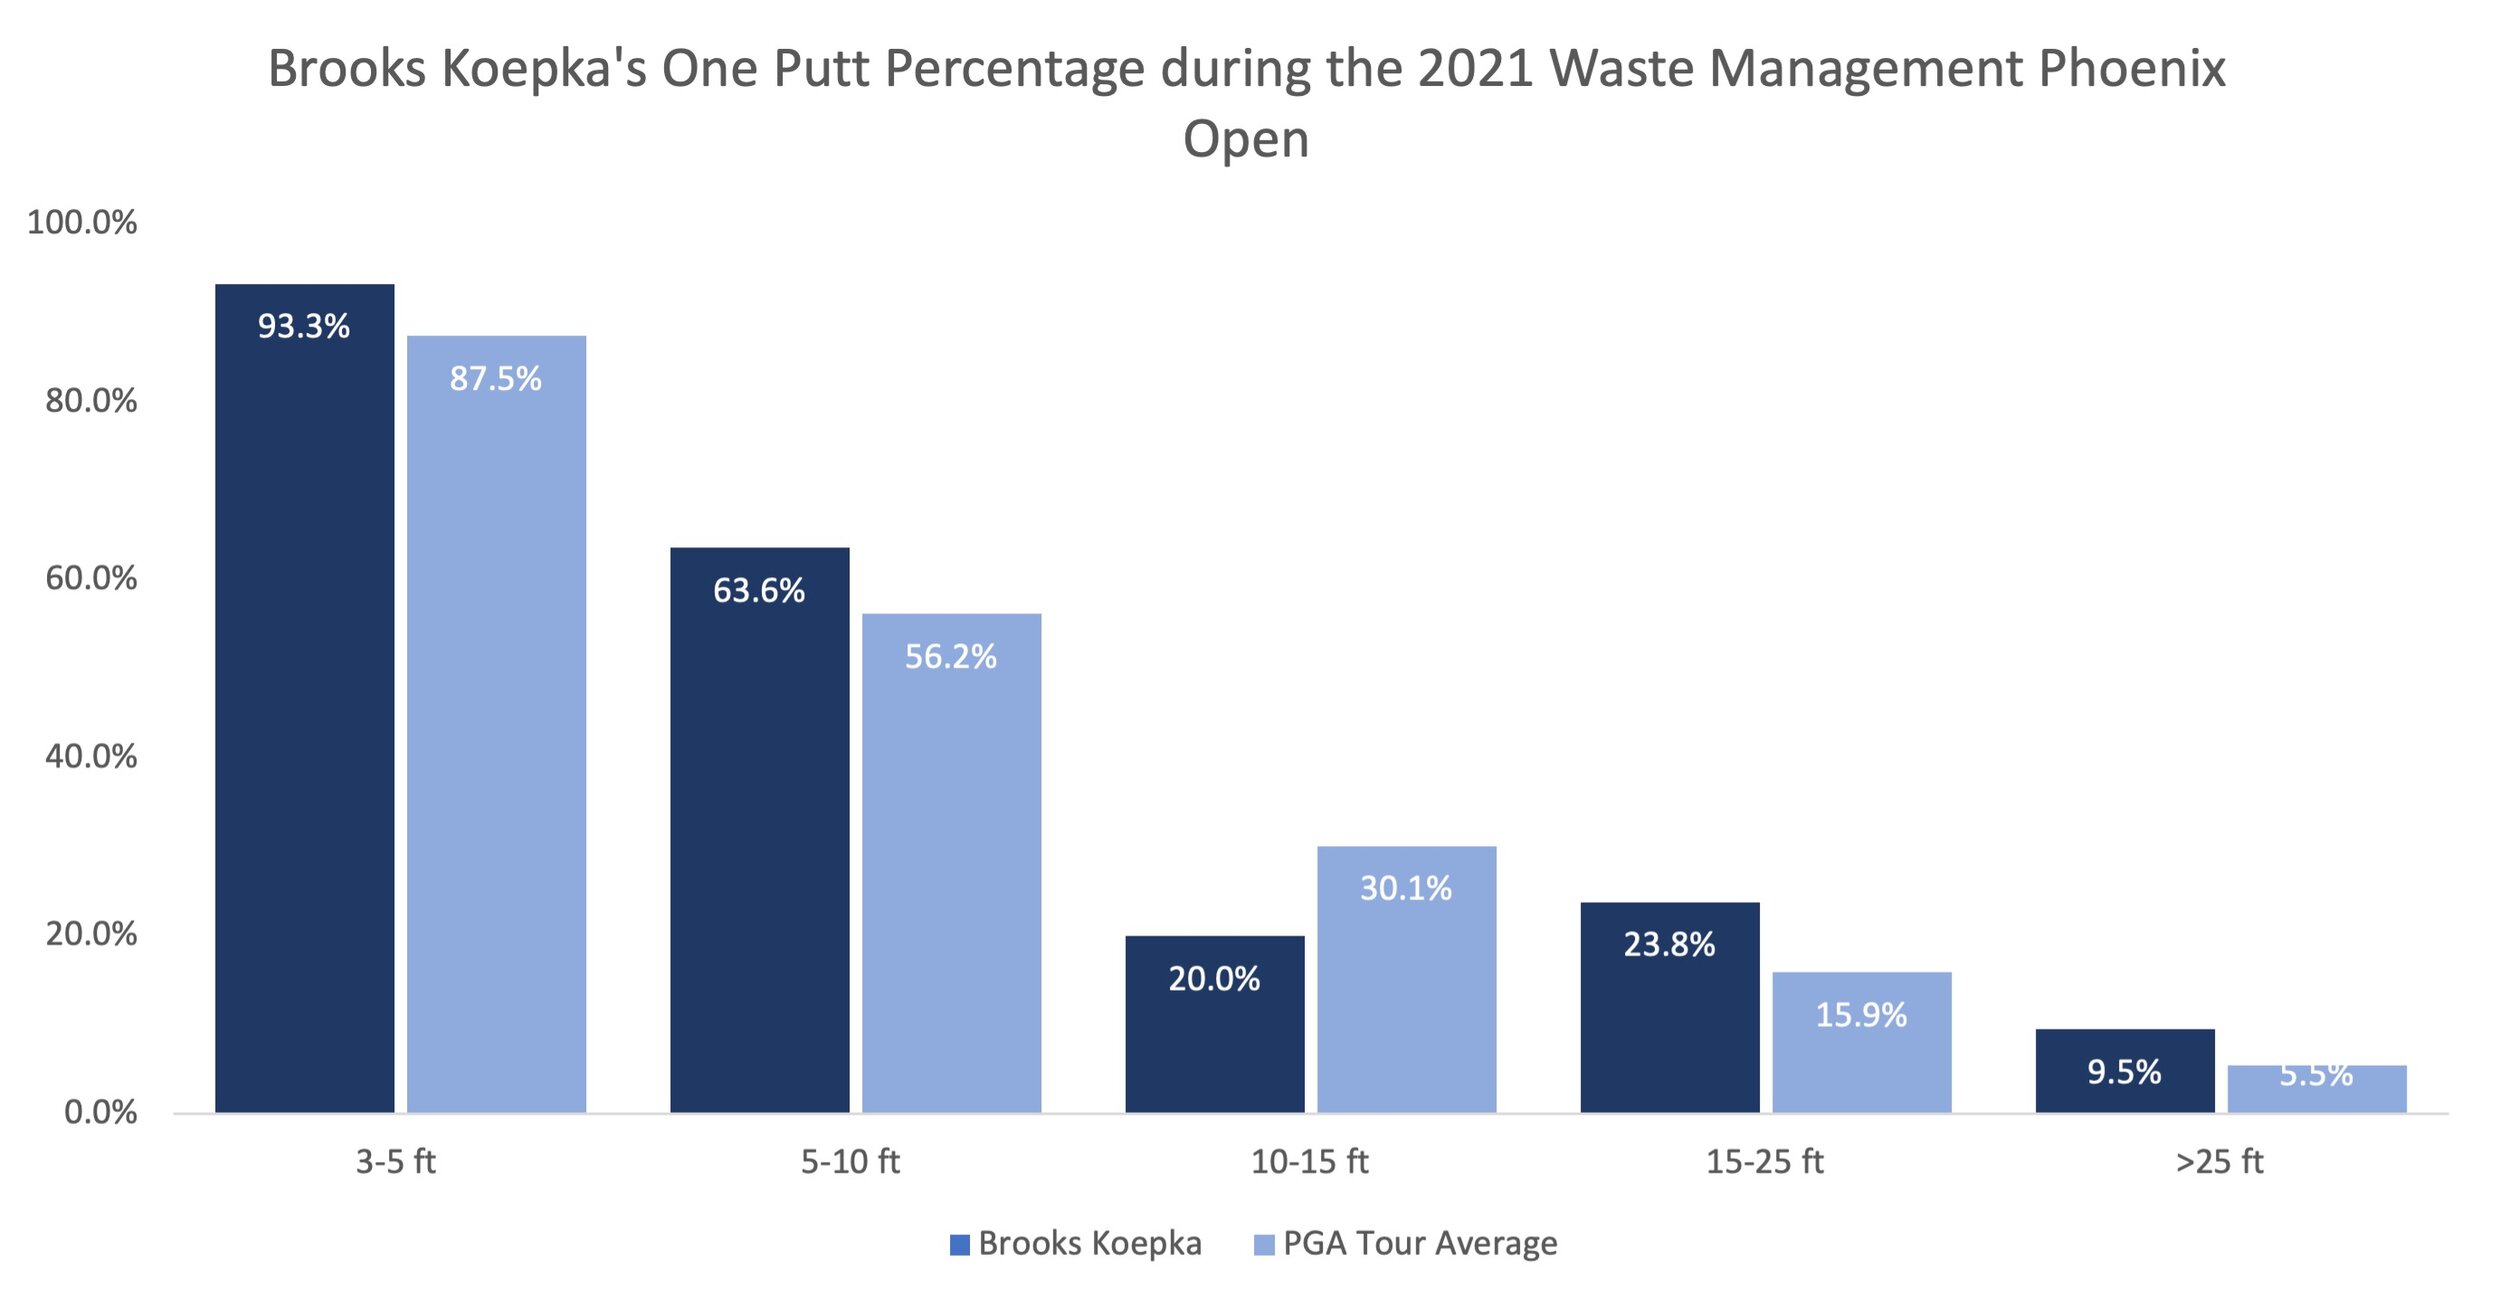
When broken down to the different distances the numbers don’t appear poor at all. In fact, inside 10 feet his numbers aren’t drastically dissimilar to the average winner and still significantly greater than the tour average from these distances.

Where he was putting from, however, was different to that of Jordan Spieth, with a high number of putts outside 15ft. The reason for this was the high number of greens in regulation (86.11%) a stat in which he ranked first for the week. If we compare those numbers to when Spieth won with a putt make percentage of 76.5%, he ranked T57 for greens in regulation (58.33%), meaning he made a lot shorter putt attempts when trying to get up and down.
What remained consistent between Spieth and Koepka’s wins was their putts inside 10 feet. The tour average inside 10ft is 87.33% in 2021. When Spieth won in Texas, he ranked 5th for putts made inside 10 feet with 92.96% and Koepka Ranked 11th when he won in Phoenix with a make percentage of 92.54% inside 10 feet.
So, what can we learn from these numbers?
We know that to win on the PGA tour you have to have a good week with the putter, but what can we learn from the data we have collected other than you need to hole putts to win?
1. Winners are consistently making more putts than average from 5-10 feet.
Whilst the number suggest winners’ putt better over distances, the significance of making putts inside 10 feet showed that you have to hole a high percentage of putts if you want to win on the PGA Tour. The majority of winners have a make percentage above 90% from inside 10 feet.
Data doesn’t always paint an accurate picture
The contrast in numbers between Spieth and Koepka highlights the fact that there is more than one way to win. However, despite Koepka’s low make percentage (33.33%) he didn’t have a bad week with the putter at all. Data can be extremely powerful but must be used in the correct way to be a useful tool
1. Data can be used to draw comparisons
What data allows us to do is draw comparisons to our performance. Knowing that you make 20% of putts from 10-15 feet is useless without context. With access to a comparison, it appears that a make percentage of 20% is poor and needs to be improved. Therefore, equipped with this information you can start to dissect whether it is your green reading or your pace control and begin to direct practice from there.
Takeaway Message
Data is an excellent tool to help direct practice and optimise course strategy. However, context always needs to be applied when looking at data. Just because Brooks Koepka made only 33% of putts, doesn’t mean that he putts poorly. To use data effectively you must paint the entire picture and isolate what is important before drawing conclusions